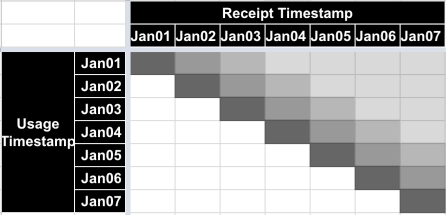
When acquiring data for the data warehouse from source systems, it can be useful to make a clear distinction between the time at which an event occurred, and the time at which the event was recorded by the source system. In the simplest case, the source system records the event at the time it occurs and the anomalies described below do not happen. But in cases where there is a delay between the actual time of the event, and the time the record of the event is received by the source system, then there's a trap that needs to be avoided.
We have found it helpful to explain the potential problems by plotting out the events in a space where the y axis shows "usage timestamp" or time at which the event occurred, and the x axis shows when the record of this event is recorded on the source system. The diagram below illustrates that for events occurring on Jan 1st, most of the records were received on Jan 1st, but that there were some received on Jan 2nd, and a further small minority of these on Jan 3rd, followed by a long tail where records were delayed a longer time.
Source system, Jan 7
If we wait until the end of Jan 7th and then extract all usage for Jan 1st, and load it up into our target data warehouse, we'll have all the Jan 1st usage up to date.
Target system, Jan 7, one file loaded
If we do this for each usage day in turn, we can get the whole set of of data up to date as of the end of Jan 7th.
Target system, Jan 7, all files loaded
Imagine then that the source system continues to record data.
Source system, Jan 14
If at the end of Jan 10th we extract usage for Jan 8 to 10 and at the end of Jan 14 we extract Jan 11 to 14, we have a problem, because usage 1-7 Jan that arrived after Jan 7th is still missing. Likewise usage 8-10 Jan that arrived after Jan 10th.
Target system, Jan 14, all files loaded
The source system carries on.
Source system, Jan 21
We may then switch to a feed that slices the data vertically by receipt timestamp rather than horizontally by usage timestamp, shown in blue below. This will not automatically solve the problem of the missing data described above.
Target system, Jan 21, all files loaded
If the problem described above exists for a feed, there will be missing records corresponding to the red sections above. In reality the boundary between the green usage timestamp extract area and the red missing record area may not be a straight line, and there can also be a ragged edge been the end of the green area and the start of the blue area.
We would highly recommend for every extract used to populate the data warehouse where that system may have separate usage and receipt timestamps, make sure that there are no gaps (or overlaps) in a plot of the type used in this post.


